
箱线图:强大的数据可视化工具
箱线图是一种图形表示形式,说明数据集的关键统计度量 - 最小值、第一四分位数、中位数、第三四分位数和最大值。 它广泛应用于数据分析中,以可视化数据的分布和偏度。
介绍
The 箱形图(也称箱须图)是一种以图形方式呈现数据集五数概括的图表:最小值、第一四分位数(第25百分位数)、中位数(第50百分位数)、第三四分位数(第75百分位数)和最大值。该图表由约翰·图基 (John Tukey) 于20世纪70年代开发,因其简洁明了地展现数据集分布而备受赞誉,从而简化了 数据分析 process.
它是一款强大的数据分析工具,因为它能够清晰地展现数据集的集中趋势、离散程度和偏度。此外,它还能有效地可视化异常值,从而提供完整的数据分布图。这在比较多个数据集时尤为有用,因为它能够清晰地呈现不同数据分布的对比信息。
核心亮点
- 箱线图以图形方式表示数据集的五个关键统计度量。
- 框中的中位数表示数据的集中趋势。
- 四分位数 Q1 和 Q3 标记方框末端,反映数据的离散度。
- 箱线图的须线达到最小和最大非异常值数据点。
- 异常值计算为低于 (Q1 – 1.5IQR) 或高于 (Q3 + 1.5IQR) 的数据点。
广告标题
广告描述。 Lorem ipsum dolor sat amet,consectetur adipiscing elit。
箱线图的基本组成部分
A 箱形图是一种用途广泛的工具,可以直观地呈现关键的统计指标。它由多个组成部分构成,每个部分都提供了对数据分布的不同见解。
箱线图的核心是中位数,用箱体内的一条线表示。第二四分位数(Q2)中位数是将数据分成两半的中间值。它衡量集中趋势,反映了数据的中心位置。
接下来,箱子由定义接下来,箱线图由第一四分位数 (Q1)和第三四分位数 (Q3)定义。这两个四分位数分别代表数据集的第 25 和第 75 百分位数。Q1 标记代表前半部分数据的中位数,而 Q3 标记代表后半部分数据的中位数。
箱线图的长度代表四分位距 (IQR),计算方法为用 Q3 减去 Q1 (IQR = Q3 – Q1)。IQR 衡量的是中间 50% 的数据范围,用于衡量数据的离散程度或分布情况。
The 须须是从箱体延伸出来的线条,分别连接到最小值和最大值的非异常值数据点。通常,下须线从 Q1 延伸到最小的非异常值数据点,上须线从 Q3 延伸到最大值的非异常值数据点。
异常值通常定义为低于 (Q1 – 1.5IQR) 或以上 (Q3 + 1.5IQR) 的数据点。这些异常值在箱线图中表现为位于须线之外的独立点。
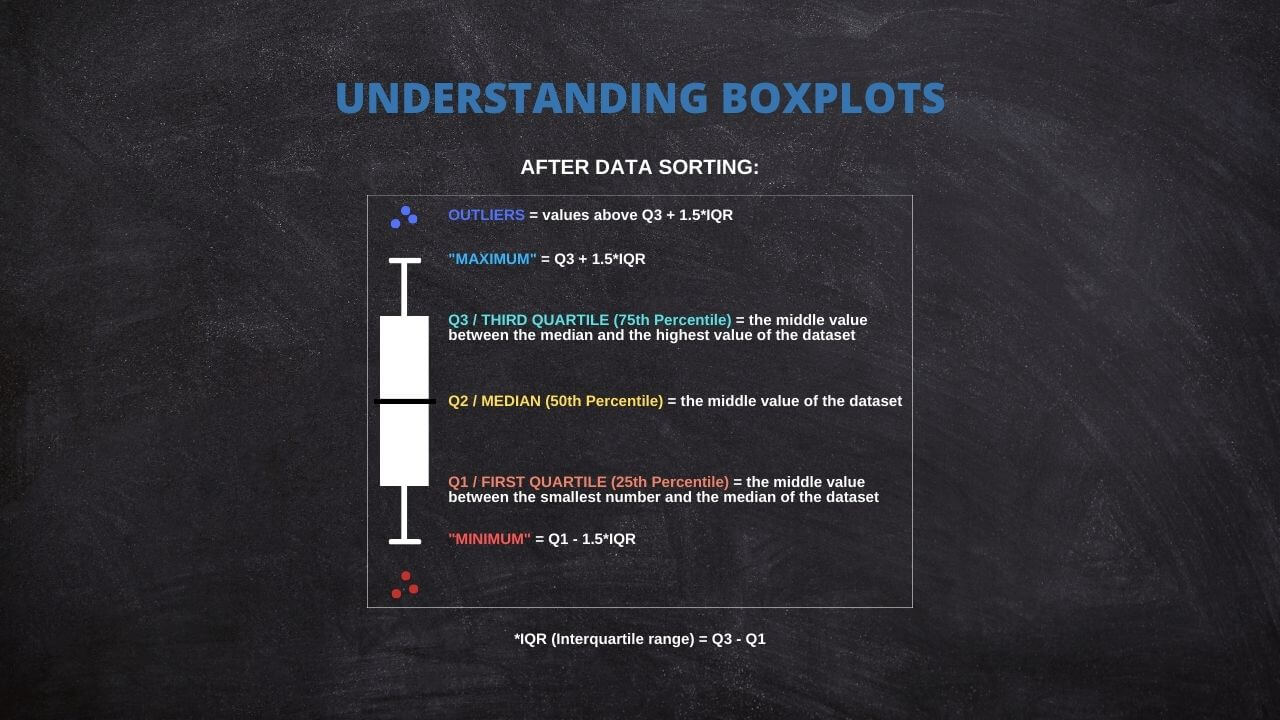
了解箱线图的这些组成部分可以快速理解数据的分布、分布和偏度。 它还有助于识别和可视化潜在的异常值,这在数据分析中非常有价值。
生成您自己的箱线图:交互式工具
按照以下说明创建交互式箱线图:
1. 箱线图数量:输入要创建的箱线图数量。
2. X 轴标签:输入所需的 X 轴标签。
3. Y 轴标签:输入所需的 Y 轴标签。
对于要生成的每个箱线图,请提供以下信息:
4. 箱线图名称:为每个箱线图输入一个唯一的名称。
5. 箱线图数据:请在提供的文本框中输入每个箱线图的数据。确保每行输入一个数据点。
输入数据后,单击“更新图”按钮以生成箱线图。
Guide to Create a Box Plot on R
R is a go-to language in data science because of its statistical computation and graphic generation robustness. Let's take a quick tour of creating a Box Plot using R.
Firstly, install and load the ggplot2 package:
install.packages("ggplot2")

library(ggplot2)
Suppose you have a dataset and wish to create a box plot of a variable, var. The code snippet would be:
ggplot(data, aes(x = "", y = var)) +

  geom_boxplot() +

  theme(axis.title.x=element_blank())
This creates a simple box plot. To add more complexity or visual features, ggplot2 offers a other options that can be appended to this code.
Practical Applications of Box Plot
Box Plots find their usage in a wide range of real-world applications. For instance, box plots can be used in healthcare to compare the effectiveness of different drugs or treatments. They may be used in finance to compare the performance of other investment portfolios.
A powerful application of box plots is in A/B testing, where they can help determine if there's a significant difference between the groups. Furthermore, they're frequently used in exploratory data analysis for identifying outliers and understanding the data distribution.
The Versatility of Box Plots
While the traditional components of a Box Plot include the minimum, first quartile (Q1), median, third quartile (Q3), and maximum, it's worth noting that some statistical software offers flexibility in defining these measures.
For instance, specific programs allow replacing these traditional measures with others, such as mean, standard deviation (SD), confidence intervals (CI), etc. This adaptability will enable users to tailor their box plots to suit their specific analytical needs or preferences.
Thus, box plots remain not just a fundamental tool for data visualization but a versatile one that can be customized across different software platforms. Always review the documentation or the settings of your chosen statistical software to fully leverage these capabilities.
Common Misconceptions When Using Box Plot
Box Plots can sometimes be misinterpreted despite their utility, leading to flawed conclusions. A common misconception is to equate the box's length with the number of data points. In reality, it represents the data's spread.
Another error is in the interpretation of outliers. Outliers are not necessarily "bad" data points to be eliminated but may provide important insights about the dataset. Therefore, careful consideration is required before any decision to remove them.
Lastly, while box plots are efficient for summarizing data, they do not show the data's shape in detail, as a density plot or a histogram would. Therefore, they are best used with other data visualization tools for a more complete data analysis.
Ad Title
Ad description. Lorem ipsum dolor sit amet, consectetur adipiscing elit.
Recommended Articles
Interested in learning more about statistics and data analysis? Explore our blog for more articles and tutorials that will help you enhance your data skills!
- How To Select The Appropriate Graph?
- Create Great Graphs Easily (+Bonus)
- Which is Better, Mean or Median?
- Boxplots - an overview (External Link)
- How to Create Regression Lines in Excel
- Box Plot Skewness: A Visual Guide to Asymmetry
Frequently Asked Questions (FAQ)
It's a graphical representation of a five-number summary of a dataset: minimum, Q1, median, Q3, and maximum.
Box Plots provide a visual summary of data distribution. They are handy for identifying outliers and skewness in the data.
The box represents the IQR, covering 50% of data points from the first quartile (Q1) to the third quartile (Q3).
The line inside the box signifies the median, a measure of the data's central tendency.
Outliers are typically represented as individual points outside the whiskers in the box plot.
Outliers are usually calculated as data points that fall below (Q1 - 1.5IQR) or above (Q3 + 1.5IQR).
Some statistical software allows replacing traditional measures with others such as mean, standard deviation, confidence intervals, etc.
Whiskers extend from the box to the minimum and maximum non-outlier data points, thus showing the range of the data.
You can input your data and create a box plot with statistical software like R or Python or an interactive web tool.
Yes, Box Plots are widely used in fields like healthcare, finance, and A/B testing for quick visualization and interpretation of data.